Ready to Get Your VFD Solution?
Whether you need a single drive or a complete system, we have the VFD products and engineering support to ensure your project's success.

To calculate VFD energy savings, subtract the post-VFD annual energy consumption from your baseline, then multiply by your electricity rate. For variable torque loads like pumps and fans, power drops with the cube of speed, so a 20% speed reduction cuts energy use by roughly 49%.
A 20% speed reduction can cut a pump’s energy bill by nearly half. Yet most facility managers still use single-speed averages that underestimate real savings by 30% or more. Your finance team wants rigor. Your utility wants proof for rebates. And you need numbers you can defend in a capital request.
This complete VFD energy saving calculation guide shows you exactly how to calculate VFD energy savings using the affinity laws, a printable multi-speed worksheet, and three worked examples you can adapt to your equipment. We’ll cover the affinity laws, variable torque and constant torque formulas, multi-speed bin analysis, payback calculations, and the honest warnings no manufacturer brochure includes.
If you want the application context first, our guide to VFD for pumps and fans explains where variable speed control delivers the biggest impact.
Key Takeaways
- For variable torque loads, power is proportional to the cube of speed. A 20% speed drop cuts power by ~49%; a 50% drop cuts it by ~87.5%.
- Always use a multi-speed bin analysis, not a single average speed. Real systems run at multiple speeds throughout the year.
- Constant torque loads (conveyors, compressors) follow linear speed-power relationships, delivering 10-20% savings, not 50%.
- Modern VFDs are 96-98% efficient. Subtract 2-4% from gross savings to account for switching and cooling losses.
- Utility rebates of $50-150 per HP can cut payback periods from 2 years to under 14 months.
For a deeper dive on single-phase input configurations, see our guide to single phase vfd guide

VFDs save energy by matching motor speed to actual demand instead of running at full speed and throttling excess flow. The amount you save depends entirely on your load type.
Centrifugal pumps, fans, and blowers follow the affinity laws, and affinity law energy savings are the reason VFD retrofits on these loads pay back so quickly. Flow is proportional to speed. Pressure is proportional to speed squared. Power is proportional to the cube of speed.
| Speed (%) | Flow (%) | Power (%) | Energy Saved |
|---|---|---|---|
| 100% | 100% | 100% | 0% |
| 90% | 90% | 72.9% | 27.1% |
| 80% | 80% | 51.2% | 48.8% |
| 70% | 70% | 34.3% | 65.7% |
| 60% | 60% | 21.6% | 78.4% |
| 50% | 50% | 12.5% | 87.5% |
This cubic relationship is why a VFD energy saving calculation for pumps and fans produces such dramatic results. At 80% speed, you consume roughly half the power. At 50% speed, you consume one-eighth.
Want to see how this applies to your specific pump or fan setup? Our guide to VFD applications for pumps and fans covers sizing, PID tuning, and minimum speed limits for fluid and air systems.
Conveyors, positive displacement pumps, and hoists are constant torque loads. Torque stays fixed regardless of speed. Power is proportional to speed, not speed cubed.
A 20% speed reduction on a conveyor saves roughly 20% energy. The savings are real but far smaller than pump and fan applications. This distinction is the single most common source of error in VFD energy saving calculation.
Machine tool spindles and winding applications need constant power. Reducing speed actually increases torque demand. VFDs here provide control benefits, not energy savings.
Most industrial energy-saving retrofits use three-phase VFDs rated from 0.75 kW to several megawatts. If you are evaluating equipment for your plant, start with the 3-phase VFD specifications to match voltage, current, and enclosure ratings to your motor nameplate data.

Here is the full formula set you need for any VFD energy savings calculator, including the variable frequency drive efficiency calculation that separates gross savings from net savings. Use these in sequence.
Baseline Power (kW) = (HP x 0.746) / Motor Efficiency
Baseline Annual kWh = Baseline Power x Annual Operating Hours
Variable Torque:
New Power = Baseline Power x (Speed Ratio)^3
Constant Torque:
New Power = Baseline Power x Speed Ratio
For each speed condition:
Annual kWh at Speed = New Power at Speed x Hours at That Speed
Sum all conditions for total post-VFD kWh.
VFD Input kWh = Post-VFD kWh / VFD Efficiency
Modern VFDs are 96-98% efficient. Use 0.96 for conservative estimates. This variable frequency drive efficiency calculation ensures you report net savings, not gross theoretical numbers.
Net Annual Savings (kWh) = Baseline Annual kWh – VFD Input kWh
Annual Dollar Savings = Net Annual Savings (kWh) x Electricity Rate ($/kWh)
Payback (years) = Total Installed Cost / Annual Dollar Savings
ROI = [(Annual Net Savings x Lifespan) – Initial Investment] / Initial Investment x 100%
Typical VFD lifespan is 10-15 years.
NPV = -Initial Investment + Sum[Annual Savings / (1 + Discount Rate)^Year]
Use this for large projects or when comparing multiple alternatives.
Maria manages a chilled water plant in Texas. Her 75 HP centrifugal pump runs 6,000 hours per year at $0.12 per kWh. She needs a VFD energy saving calculation for her capital request.
Her initial estimate used a single average speed of 75%. That predicted $12,400 per year in savings. But Maria collected actual runtime data from her building management system. The pump does not run at one average speed. It runs in distinct bands.
| Speed Band | Hours/Year | Speed Ratio | Power Ratio | kWh Used |
|---|---|---|---|---|
| Full speed | 1,800 | 1.00 | 1.000 | 107,460 |
| 80% speed | 2,400 | 0.80 | 0.512 | 91,584 |
| 60% speed | 1,800 | 0.60 | 0.216 | 38,664 |
| Total | 6,000 | 237,708 |
Baseline motor power: (75 x 0.746) / 0.94 = 59.5 kW
Baseline annual kWh: 59.5 x 6,000 = 357,000 kWh
Baseline annual cost: 357,000 x 0.12=0.12=42,840
Post-VFD annual kWh (before losses): 237,708 kWh
VFD input kWh (at 96% efficiency): 237,708 / 0.96 = 247,613 kWh
Net annual savings: 357,000 – 247,613 = 109,387 kWh
Annual dollar savings: 109,387 x 0.12=0.12=13,126
Maria’s single-speed estimate missed the mark by $726 per year. More importantly, it missed the peak-load reality. The pump still runs full speed 30% of the time. The VFD does not eliminate that consumption. It only optimizes the partial-load hours.
Installed cost estimate: 8,500(VFD+installation+commissioning)Paybackperiod:8,500(VFD+installation+commissioning)Paybackperiod:8,500 / $13,126 = 0.65 years = 7.8 months
A 7.8-month payback on a 75 HP pump is typical for variable torque retrofits. The actual payback depends on VFD price, enclosure type, and whether you need a bypass contactor. You can compare VFD prices and protection classes for the HP range in this example.
If you are sizing a drive for this type of application, our VFD sizing guide walks through FLA matching, Normal Duty vs Heavy Duty selection, and overload settings.
Tom runs maintenance at a distribution center in Ohio. His 50 HP conveyor moves packages 8,000 hours per year. He installed a VFD expecting 40% energy savings because he used pump math.
The conveyor is a constant torque load. The affinity laws do not apply.
Baseline motor power: (50 x 0.746) / 0.93 = 40.1 kW
Baseline annual kWh: 40.1 x 8,000 = 320,800 kWh
Baseline annual cost: 320,800 x 0.11=0.11=35,288
The conveyor runs at 85% speed for 6,000 hours and 60% speed for 2,000 hours (overnight reduced flow).
At 85% speed (constant torque):
New power = 40.1 x 0.85 = 34.1 kW
kWh = 34.1 x 6,000 = 204,600
At 60% speed (constant torque):
New power = 40.1 x 0.60 = 24.1 kW
kWh = 24.1 x 2,000 = 48,200
Total post-VFD kWh: 252,800
VFD input kWh (96%): 263,333
Net annual savings: 320,800 – 263,333 = 57,467 kWh
Annual dollar savings: 57,467 x 0.11=0.11=6,321
Tom’s pump-math prediction of 40% savings would have been $14,115 per year. The actual energy savings are 17.9%. The project would have failed its payback target if energy alone were the justification.
However, the VFD eliminated three belt replacements per year (1,800each)andreducedbearingfailuresby601,800each)andreducedbearingfailuresby6011,721. Payback including maintenance benefits: 14 months.
The lesson is clear. For constant torque loads, run a VFD energy saving calculation for the actual load type. Then add soft-start and maintenance benefits to build the full business case.
Sizing a VFD for constant torque is different from sizing for variable torque. You must select a Heavy Duty rating, set the correct overload class, and verify the drive can deliver 150% torque for 60 seconds at startup. Our VFD sizing guide for motors covers Normal Duty vs Heavy Duty selection and FLA matching for conveyors and hoists.
Jennifer is a plant engineer in California. Her 30 HP HVAC supply fan runs 4,000 hours per year at 0.18perkWh.Thelocalutilityoffers0.18perkWh.Thelocalutilityoffers125 per HP for VFD retrofits on HVAC equipment.
Baseline motor power: (30 x 0.746) / 0.93 = 24.1 kW
Baseline annual kWh: 24.1 x 4,000 = 96,400 kWh
Baseline annual cost: 96,400 x 0.18=0.18=17,352
The fan runs on a VAV schedule:
At 100% speed: 24.1 x 800 = 19,280 kWh
At 80% speed: 24.1 x 0.512 x 1,600 = 19,742 kWh
At 60% speed: 24.1 x 0.216 x 1,600 = 8,329 kWh
Total post-VFD kWh: 47,351
VFD input kWh (96%): 49,324
Net annual savings: 96,400 – 49,324 = 47,076 kWh
Annual dollar savings: 47,076 x 0.18=0.18=8,474
Without the rebate, installed cost is $6,200. Payback would be 8.8 months.
Utility rebate: 30 HP x 125=125=3,750
Adjusted installed cost: 6,200−6,200−3,750 = $2,450
Adjusted payback: 2,450/2,450/8,474 = 0.29 years = 3.5 months
The rebate application took Jennifer 45 minutes online. It changed a good project into an undeniable one.
For HVAC-specific calculations, our online HVAC VFD savings calculator can run these numbers instantly for your building’s fan and pump loads.

The U. S. Department of Energy recommends bin analysis for accurate VFD energy saving calculation and VFD payback period calculation. Instead of guessing an average speed, you record how many hours the motor spends at each speed band.
| Speed Band | Hours/Year | Speed Ratio | Power Ratio (Variable Torque) | kWh at This Speed |
|---|---|---|---|---|
| 100% | 1.00 | 1.000 | ||
| 90% | 0.90 | 0.729 | ||
| 80% | 0.80 | 0.512 | ||
| 70% | 0.70 | 0.343 | ||
| 60% | 0.60 | 0.216 | ||
| 50% | 0.50 | 0.125 | ||
| Total Post-VFD kWh | Sum |
Motor Power (kW): _____
Baseline Annual kWh: _____
VFD Input kWh (divide by 0.96): _____
Net Annual Savings (kWh): _____
Electricity Rate ($/kWh): _____
Annual Dollar Savings: _____
Installed Cost: _____
Payback Period (months): _____
If you do not have detailed logs, start with operator estimates. Ask your maintenance team: “How many hours per day does this pump run at full speed versus throttled?” Even rough estimates produce more accurate results than assuming a single average.
Every VFD energy saving calculation has limits. Here are the most common ways theoretical savings fail to materialize.
The affinity laws assume zero static head. If your pump lifts water to a tank 50 feet above, that elevation does not change with speed. The minimum practical speed is often 65-75% before you lose flow entirely. Savings above that threshold are real. Below it, the pump simply cannot deliver.
Reducing pump speed lowers suction pressure. If you are already near your Net Positive Suction Head (NPSH) limit, slowing the pump invites cavitation. The impeller erodes. Energy savings become repair costs.
Many pumps have a manufacturer-specified minimum flow to prevent overheating. A VFD cannot violate that limit. Check your pump curve before assuming 50% speed is achievable.
If an exhaust fan operates against a strong natural draft, reducing speed too far can cause the fan to windmill backward. The motor becomes a generator. Install backdraft dampers or set a minimum forward speed.
Large VFD installations may require line reactors, dv/dt filters, or active harmonic filters. These add $500-3,000 to installed cost. They are not in the base VFD price. Include them in your payback calculation.
The VFD cooling fan runs whenever the drive is powered, even at zero output. On small drives this is negligible. On large drives, auxiliary consumption can reach 1-2% of rated power.
Your baseline matters. If you compare a VFD to an already-optimized system, savings shrink. If you compare to mechanical throttling, savings expand.
| Control Method | Energy at 80% Flow | Energy at 60% Flow | Why It Wastes Energy |
|---|---|---|---|
| No control (full speed) | 100% | 100% | Motor runs full speed regardless of demand |
| Outlet damper | ~95% | ~85% | Damper restricts flow but motor stays at full speed |
| Inlet vane | ~85% | ~70% | Slightly better than damper; still wastes energy |
| VFD speed control | 51.2% | 21.6% | Motor slows to match demand exactly |
This table is why VFD retrofits on damper-controlled systems pay back faster than greenfield installations. The baseline is worse. You are not just adding a VFD. You are replacing an energy-wasting control method.
| Application | Load Type | Typical Savings | Payback |
|---|---|---|---|
| Centrifugal pump | Variable torque | 30-60% | 6-18 months |
| HVAC supply fan | Variable torque | 35-50% | 8-24 months |
| Cooling tower fan | Variable torque | 40-60% | 6-18 months |
| Wastewater aeration blower | Variable torque | 40-65% | 6-14 months |
| Conveyor belt | Constant torque | 10-20% | 2-4 years |
| Air compressor | Constant torque | 15-25% | 1.5-3 years |
| Grinder / machine tool | Constant power | 5-10% | 4-7 years |
| Positive displacement pump | Constant torque | 10-20% | 2-4 years |
These ranges assume variable-load operation. A pump that truly runs 100% speed, 100% of the time saves nothing with a VFD.
Calculate baseline annual kWh from motor HP, efficiency, and operating hours. Determine your actual speed profile using BMS logs or operator estimates. Apply the affinity laws for variable torque loads (power = speed^3) or linear reduction for constant torque. Sum kWh across all speed bands. Subtract VFD efficiency losses (~4%). Multiply net kWh savings by your electricity rate for annual dollar savings. Divide installed cost by annual savings for payback.
You can, but you will likely underestimate savings by 20-40%. Real systems rarely run at one steady partial speed. They cycle between full speed, partial speed, and idle. A multi-speed bin analysis captures this reality and produces defensible numbers.
Run separate bin analyses for each season, then weight by seasonal hours. A cooling tower fan in Chicago might run 2,000 hours at 100% in July but only 400 hours in November. Seasonal binning prevents averaging away peak-demand reality.
Use your blended average rate ($/kWh) from your utility bill, not the nominal rate. Include demand charges if they apply. Some utilities offer time-of-use rates where off-peak VFD operation saves more than on-peak. Use the rate that matches your actual operating hours.
No. At full speed, a VFD adds 2-4% losses compared to a direct across-the-line starter. The energy savings come entirely from speed reduction. If your motor never drops below 95% speed, a VFD will not save energy. It may still justify itself through soft-start and process control benefits.
Within 10-15% if you use actual operating data. Within 30-50% if you guess load profiles. The biggest source of error is assuming a constant average speed. The second biggest is ignoring static head, minimum flow, or NPSH limits on pumps.
Yes, for constant torque applications where energy savings alone are modest. Soft-start eliminates mechanical shock. Bearings last 20-30% longer. Belts and couplings need less frequent replacement. For variable torque pump applications, maintenance savings are smaller because the baseline already had lower mechanical stress.
The formula is identical to any variable torque application. For an HVAC fan: baseline kWh = (HP x 0.746 / efficiency) x hours. Post-VFD kWh = sum of (baseline power x speed_ratio^3 x hours_at_speed) for each speed band. Divide by VFD efficiency (0.96). Subtract from baseline. Multiply by $/kWh. If you want to skip the spreadsheet, our HVAC VFD savings calculator runs these numbers instantly for your building’s fan and pump loads.
Subtract the rebate amount from your total installed cost before calculating payback. A 10,000installationwitha10,000installationwitha3,750 rebate has an effective cost of $6,250. Rebates do not change annual savings. They only improve payback and ROI. Check your utility’s website or call their commercial efficiency program.
Payback periods range from 3.5 months to 2 years depending on load type, operating hours, and utility rebates. Variable torque applications like pumps and fans typically pay back in 6-18 months. Constant torque loads like conveyors often take 2-4 years unless maintenance savings are included.
A VFD reduces energy consumption by lowering motor speed to match actual demand instead of running at full speed and throttling excess output. For variable torque loads, power drops with the cube of speed, so even small speed reductions produce large energy savings.
A rigorous VFD energy saving calculation is not complicated once you know your load type and operating profile. The affinity laws give you the physics. The bin worksheet gives you the rigor. The VFD payback period calculation gives you the business case. And the three worked examples show you how the numbers change across applications.
The key is honesty. Use multi-speed data, not single averages. Account for VFD losses. Respect pump minimums and static head. And for constant torque loads, build the full case including maintenance and soft-start benefits.
Run the numbers for your biggest motor. If payback is under 18 months and the motor runs at partial load more than 30% of the time, the project is almost certainly worth pursuing.
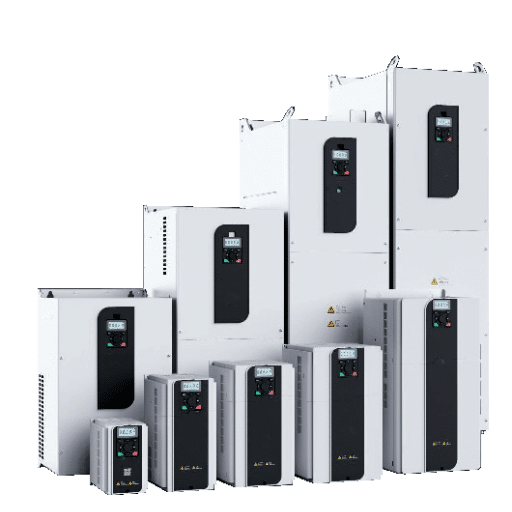
Ready to select a drive for your application? Browse our VFD product range to compare specifications, protection features, and pricing across low voltage and high voltage systems. If you need help matching a drive to your motor and running these calculations for your specific equipment, contact our engineering team for a recommendation.