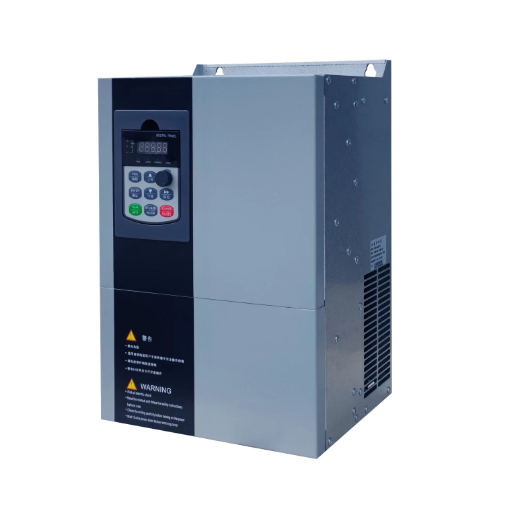
Ready to Get Your VFD Solution?
Whether you need a single drive or a complete system, we have the VFD products and engineering support to ensure your project's success.


Documented VFD case studies show energy savings of 12-44% in real industrial installations, with payback periods of 11 to 30 months depending on load type and running hours. The largest measured savings come from variable-torque loads: a 160 kW cooling tower fan retrofit cut energy use by 44%, while a municipal water pump station saved 38%. Below are five VFD case studies with energy savings verified by before-and-after metering, including one retrofit that underperformed its projection.
Tom, an energy manager at a packaging plant, learned why this evidence matters the hard way. He walked into a budget meeting with a solid projection: 32% savings on the plant’s four largest fans, backed by affinity-law math. The CFO asked one question: “Where has this actually been measured?” Tom’s projection died that afternoon. The project only got approved six months later, when he returned with a sister plant’s twelve-month metered report showing 29% savings on identical equipment.
That gap between estimated and proven is what this article closes. Every case below follows the same format: the site’s baseline, what was installed, what the meters showed afterward, and how long payback actually took. One case underperformed badly, and we included it on purpose because knowing why projections fail is worth more than another success story.
If you want the formulas behind these numbers first, see our guide on how to calculate VFD energy savings. This article is about what happened when the math met the utility meter.
Key Takeaways
- Measured VFD energy savings across real retrofits range from 12% to 44%; variable-torque loads (fans, pumps) deliver the high end
- Payback periods in these five cases ran 11-30 months, driven more by running hours and energy price than by motor size
- Constant-torque loads like conveyors show modest energy savings (17%) but often pay back faster through reduced maintenance and downtime
- One retrofit achieved only 12% against a 30% projection because the load ran at full speed; load profiling before quoting prevents this
- Credible savings claims require baseline metering before the retrofit and at least 3-12 months of post-installation data

Before the cases themselves, one distinction matters more than any percentage: the difference between estimated savings and measured savings. Estimates come from affinity laws and load assumptions. Measured savings come from meters, and they are the only numbers that survive a CFO’s questions.
When you evaluate any variable frequency drive case study, including ours, check for four things:
The International Performance Measurement and Verification Protocol (IPMVP), maintained by the Efficiency Valuation Organization, formalizes exactly this approach. The five cases below follow that discipline: each has a metered baseline, a defined measurement period, and runtime-adjusted results.
A municipal water utility in Southeast Asia ran two 90 kW centrifugal pumps in duty/standby, controlling flow with a throttling valve. Baseline metering over four weeks showed the duty pump drawing 78 kW average, 6,500 hours per year, with the valve routinely 40% closed.
Daniel, the utility’s energy engineer, replaced the valve control with a low-voltage VFD running on level control from the wet well. The valve was locked fully open. Total installed cost came to $21,000 including commissioning.
Twelve months of utility meter data showed average draw falling from 78 kW to 48 kW. That’s a 38% reduction, roughly 195,000 kWh per year, worth about $17,500 at local tariffs. Payback landed at 14 months, slightly ahead of the 18-month projection, because the projection hadn’t credited the reduced pump wear that eliminated one planned seal replacement.
The lesson: variable-torque loads with a throttling restriction are the closest thing to guaranteed savings in this industry. If your baseline shows a valve or damper doing the controlling, the VFD business case writes itself. It is the single most repeatable VFD energy savings case study pattern we see.

A chemical plant on the US Gulf Coast operated a 160 kW cooling tower fan on two-speed control: full speed in summer, low speed when someone remembered to switch it. Priya, the plant engineer, suspected the fan ran full speed far more often than the process needed. Baseline logging confirmed it: the fan spent 70% of logged hours at full speed, even at night when ambient temperatures dropped 10°C below design.
The retrofit installed a VFD with temperature-following control, modulating fan speed to hold condenser water at setpoint. Installed cost: $34,000.
Because cooling load varies with weather, Priya’s team normalized results against cooling degree days rather than comparing raw bills. The corrected measurement showed a 44% energy reduction, about 310,000 kWh annually, worth roughly $25,000. Payback: 16 months.
Two details made this case credible. First, the seasonal correction: without it, a mild winter would have exaggerated the savings. Second, the persistence check: a follow-up review at 24 months showed savings holding at 42%, with the small decline traced to operators occasionally overriding the setpoint during heat waves.
A 12-story commercial complex retrofitted VFDs onto four air handling unit fans (45 kW each) and two chilled water pumps (37 kW each), all previously run at fixed speed with damper and valve control. The drives were integrated with the building management system, following occupancy schedules and static pressure setpoints.
Measured results from the VFD retrofit over a nine-month period showed a combined energy saving of 31%—approximately 420,000 kWh annually—across six motors. Based on a commercial rate of $0.14 per kWh, this equates to an annual saving of $59,000 against a project cost of $68,000, resulting in a payback period of 14 months.
Miguel, the facility director, flagged one practical lesson that rarely makes it into case studies. Early commissioning let fans slow to 35% at night, which triggered draft and stuffiness complaints from a floor with after-hours tenants. Setting a 50% minimum speed on AHUs solved it, costing about 2 points of savings but ending the complaints. Real projects involve people, not just load profiles.
HVAC and pump applications like this are where our low voltage VFD systems spend most of their service life, and where the savings math is most forgiving.

Not every case is a fan or pump, and this one proves the point. An appliance manufacturer in Ohio ran a 300-meter conveyor line on six 15 kW motors, direct-on-line starting, moving packaged units 16 hours a day.
The retrofit, six compact drives installed for about $28,000, delivered 17% energy savings. Respectable, but not the headline. The real return came from what soft starting did to the mechanical system: belt replacements dropped from three per year to one, gearbox rebuilds fell from an annual event to none in two years, and jam-related line stoppages fell 60% as controlled acceleration stopped product pile-ups at transfer points.
Annual energy savings amount to approximately $9,000, while the total value associated with maintenance and downtime approaches $40,000. The payback period is 11 months, with energy savings accounting for less than one-quarter of the total return. Today, the plant’s team configures variable frequency drives (VFDs) as a standard feature when planning new conveyors, and energy savings are no longer the primary factor in their return on investment (ROI) analysis templates.
Constant-torque loads monetize differently. If your application is conveyors, crushers, or hoists, the measured benefits of VFDs in mining operations show the same pattern in heavier industry: energy savings are real, but reliability often writes the bigger check.
Every vendor’s website is a wall of success stories, so here is the opposite. Rachel, an energy manager at a food processing plant, approved a VFD retrofit on a 110 kW air compressor based on a vendor’s projection of 30% savings. The $26,000 project went ahead without a single day of load logging.
Twelve months of metering showed 12%. Nothing was broken. The drive worked exactly as designed. The problem was the load: the compressor ran at 95-100% capacity around the clock because the plant’s air demand was constant and near the machine’s rated output. There was no part-load operation for a VFD to exploit. The projection had been built from a generic “compressors save 30%” assumption, not from this plant’s actual load profile.
The fix wasn’t the drive; it was the system. A leak repair program and a smaller trim compressor for night shifts cut demand enough to let the main unit unload regularly, and savings eventually reached 24%. Rachel’s takeaway, now policy at her company: no VFD proposal gets approved without two weeks of logged load data first.
That discipline is what separates real-world VFD energy savings from brochure numbers. If a supplier quotes savings without asking for your load profile, you’re looking at a marketing estimate, not an engineering one.

Here is what these VFD case studies’ energy savings look like side by side:
| Case | Application | Motor Size | Measured Savings | Payback |
|---|---|---|---|---|
| 1 | Municipal water pumps | 2 x 90 kW | 38% | 14 months |
| 2 | Cooling tower fan | 160 kW | 44% | 16 months |
| 3 | HVAC fans & pumps | 6 motors, 37-45 kW | 31% | 14 months |
| 4 | Conveyor line | 6 x 15 kW | 17% (+ maintenance) | 11 months |
| 5 | Air compressor | 110 kW | 12% (24% after fix) | 30+ months |
Three patterns hold across all five. Variable-torque loads with mechanical throttling deliver 30-45%. Constant-torque loads deliver 10-20% in energy but often more through reliability. And every projection that skipped load profiling, whether optimistic or pessimistic, was wrong. These VFD payback period examples also cluster tightly: 11 to 16 months for every variable-torque retrofit, with the constant-speed compressor the clear outlier.
If you’re planning a retrofit, borrow the discipline these cases used:
The U. S. Department of Energy publishes motor systems resources with the same message: measure first, then calculate, then invest.
Estimates based on affinity laws are directionally reliable for fans and pumps but routinely overshoot by 5-15 points because they assume ideal part-load operation. Estimates built from your metered load profile, like the ones in these VFD case studies, typically land within a few points of measured results. For the underlying ranges by load type, see our breakdown of typical VFD energy saving percentages.
Across documented industrial retrofits, 6-30 months cover most cases. Fans and pumps with long running hours sit at the fast end. Constant full-speed loads may never pay back on energy alone, as Case 5 shows.
Slightly, if unmanaged. Operator setpoint overrides, process drift, and fouled equipment typically erode 10-20% of projected savings within a year. A 12-month persistence check and locked setpoints keep that in check, as the cooling tower case demonstrated.
Throttled centrifugal pumps and damper-controlled fans, consistently 30-50% in metered installations. The more a fixed-speed system wastes across a restriction, the more a drive recovers.
These VFD case studies put real numbers on the energy savings question: 12-44% measured across five industrial retrofits, with payback between 11 and 30 months. Three conclusions matter more than any single figure.
First, savings are real but load-dependent: throttled fans and pumps deliver 30-45%, while constant-torque machines monetize through reliability instead. Second, measurement discipline separates engineering from marketing; every credible case here started with baseline metering. Third, even a failed projection is recoverable if you fix the system instead of blaming the drive.
The strongest business case for your site won’t come from any case study, including these. It comes from two weeks of your own load data.
Ready to build yours? Send us your motor list and running hours, and the Shandong Electric engineering team will return an ROI projection based on your load profile, with a metering plan to verify it after installation. Our low and high voltage VFD range covers every application in these cases, from 15 kW conveyors to 160 kW cooling tower fans.